A solder paste quotation is usually shown as a price per jar, syringe, cartridge or kilogram. That number matters to purchasing, but it does not reveal the material cost of each good PCB.

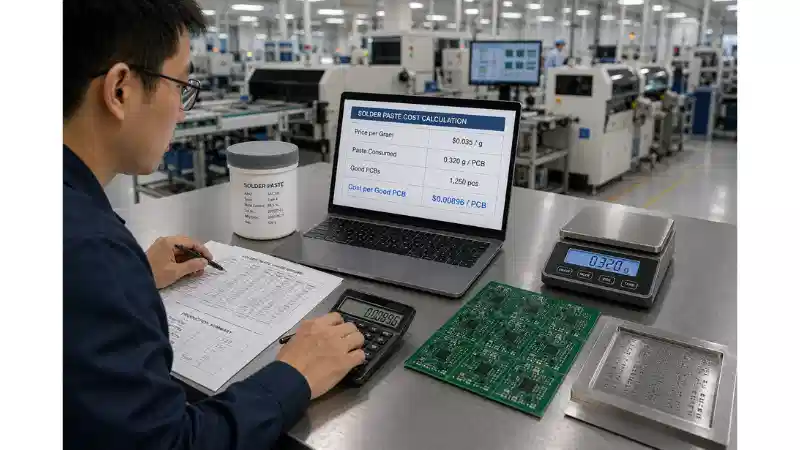
The true solder paste cost per PCB depends on the landed material price, the mass consumed during printing or dispensing, and the production losses allocated to the boards that pass the defined acceptance criteria.
Use actual consumption data for an established line. Use a geometry-based planning model before production begins. Do not combine the two methods or apply yield twice.
Quick Answer
For a completed production period, use:
Actual cost per good PCB = Net paste consumed in grams × landed price per gram ÷ actual good PCBs produced
For preproduction planning, use:
Estimated cost per good PCB = Estimated paste cost per printed PCB ÷ expected good-board rate
The actual-period method already uses good boards as the denominator, so it must not be divided by yield a second time.
Define the Cost Boundary Before Calculating
The phrase solder paste cost can refer to several different accounting scopes. Define the scope before comparing products or suppliers.
| Cost Category | Typical Contents | How It Should Be Used |
|---|---|---|
| Purchase price | Quoted material price per package or kilogram | Procurement comparison |
| Recurring direct material cost | Paste consumed, discarded and written off during normal production | Cost per printed or good PCB |
| Recurring paste-related conversion cost | Storage, handling, cleaning and rework labor when the company allocates them separately | Manufacturing-cost analysis |
| One-time qualification cost | Trials, SPI studies, profile development and approval testing | Project or change-control budget |
| Total cost of ownership | Direct, indirect and qualification costs under a defined allocation method | Supplier or material-change decision |
Do not add qualification, downtime or rework to the material cost if those items are already included elsewhere in the company's costing system.
Three Numbers Buyers Often Confuse
Supplier Price per Kilogram
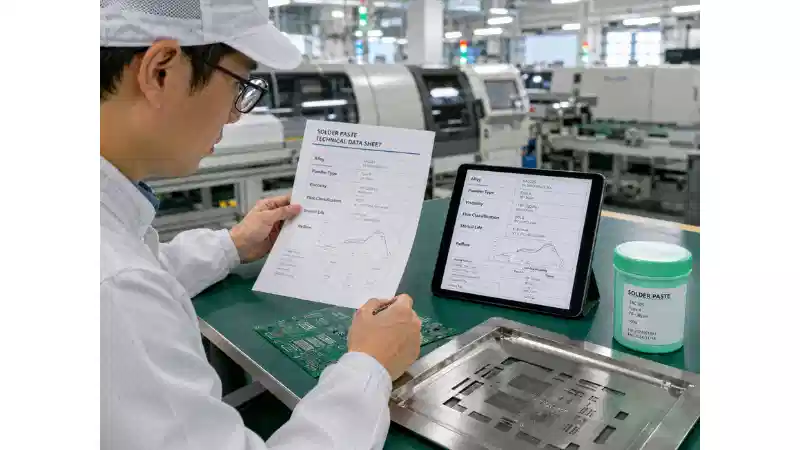
This is one input to the calculation. It may vary with alloy, powder Type, flux formulation, package, order volume, documentation, currency and delivery terms.
Direct Paste Cost per Printed PCB
This is the recurring paste cost allocated to every board or panel that enters the printing process, before the effect of yield is considered.
Total Paste Cost per Good PCB
This divides the defined paste cost by the boards that meet the selected acceptance basis. The denominator may be first-pass good boards, final accepted boards after approved rework or shipped boards, but the same definition must be used consistently.
What Determines the Supplier's Solder Paste Price?
A quotation normally reflects both material design and commercial terms.
| Price Factor | Why It Can Affect the Quote |
|---|---|
| Alloy composition | Different tin, silver, copper, bismuth and other metal contents create different raw-material and process requirements. |
| Powder Type | Finer powder may require tighter atomization, classification, oxidation control and flux matching. |
| Flux formulation | No-clean, washable, zero-halogen, low-temperature, low-voiding and jetting formulations may have different performance and qualification requirements. |
| Packaging | Jars, syringes, cartridges and small rework packs have different filling, residual and handling costs. |
| Testing and traceability | Batch testing, CoA, controlled specifications and customer-specific documents add value and cost. |
| Commercial terms | MOQ, freight, duties, cold-chain handling, currency, payment terms and quotation validity affect landed cost. |
The guide to tin solder alloys for PCB assembly explains why two lead-free pastes can have different metallic compositions and process windows. Powder choice should also be reviewed together with the physical properties of solder paste, not selected by price alone.
Method 1: Calculate Actual Cost from Production Records
This method is preferred after production data is available.
Step 1: Select a Measurement Period
Use a defined period such as one batch, shift, week or month. All inventory, issue, return and output records must cover the same period.
Step 2: Calculate Net Paste Consumption
Use the following inventory boundary:
Net paste consumed = Opening usable line inventory + paste issued to the line − closing usable line inventory − paste formally returned to stock
If the company's issue record is already net of returns, omit the separate returned-to-stock term. Do not subtract the same remainder twice.
Use net paste mass, not gross package weight. Container tare, protective caps and unusable packaging must not be counted as paste.
Step 3: Calculate Landed Price per Gram
Landed price per gram = Total landed material cost ÷ usable grams received
Landed cost may include freight, duties and other charges when the company's accounting policy assigns them to material.
Step 4: Count Actual Good Boards
Use the selected acceptance basis consistently. When production is recorded by panel, convert accepted panels into usable PCB units and account for bad-marked or scrapped units.
Step 5: Calculate Actual Cost per Good PCB
Actual cost per good PCB = Net paste consumed × landed price per gram ÷ actual good PCB units
This formula already includes the effect of scrap and poor yield because the denominator contains only actual good units.

Illustrative Actual-Period Example
The following numbers are hypothetical and are included only to demonstrate the calculation.
| Opening usable line inventory | 200 g |
|---|---|
| Paste issued during the period | 2,000 g |
| Closing usable line inventory | 150 g |
| Paste formally returned to stock | 100 g |
| Landed price | 0.072 currency units per gram |
| Actual good PCB units | 9,000 |
Net paste consumed = 200 + 2,000 − 150 − 100 = 1,950 g
Total paste cost = 1,950 × 0.072 = 140.40 currency units
Actual paste cost per good PCB = 140.40 ÷ 9,000 = 0.0156 currency units
No additional yield division is applied because 9,000 is already the actual good-board count.
Method 2: Estimate Cost Before Production
When no consumption history exists, estimate deposited mass from stencil or programmed-deposit geometry and then add a separate process-loss allowance.
Step 1: Calculate Theoretical Aperture Volume
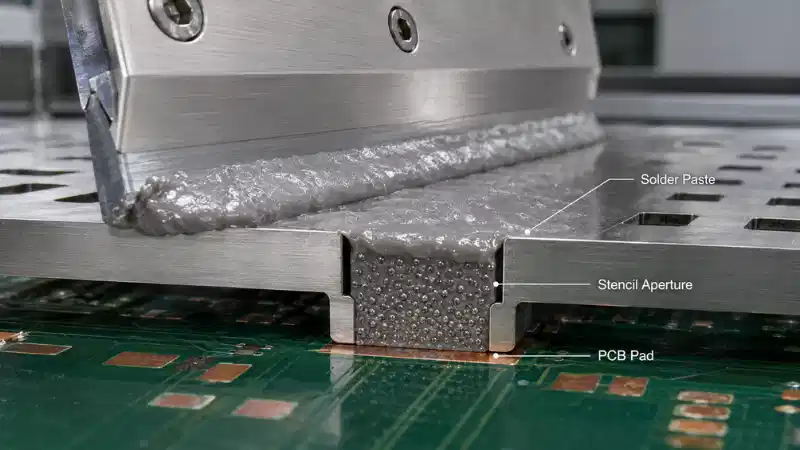
Theoretical aperture volume in mm³ = Sum of aperture area in mm² × stencil thickness in mm
Complex openings may require CAD or stencil-design data. Review the selected process against the available solder paste application methods.
Step 2: Apply Transfer Efficiency
Deposited volume in mm³ = Theoretical aperture volume × transfer efficiency
Express transfer efficiency as a decimal. For example, 85% is entered as 0.85. Use SPI or comparable line data when available rather than assuming one value for every aperture.
Step 3: Convert Volume to Mass
When volume is in mm³ and paste density is in g/cm³:
Deposited mass in grams = Deposited volume in mm³ × paste density in g/cm³ ÷ 1,000
Use the density stated for the selected material where available. The solder paste working principle explains why alloy powder, metal content and flux vehicle must be treated as a complete formulation.
Step 4: Add Process Loss
Gross paste requirement per printed PCB = Deposited mass per PCB + allocated process loss per PCB
Process loss may include printer setup, stencil remainder, understencil cleaning, trial prints, changeover and package residual. Use a comparable process initially, then replace the estimate with actual data.
Step 5: Apply the Expected Good-Board Rate
Estimated cost per printed PCB = Gross paste requirement × landed price per gram
Estimated cost per good PCB = Estimated cost per printed PCB ÷ expected good-board rate
This yield adjustment belongs only to the planning model when the numerator is calculated per board entering the process.

Illustrative Preproduction Calculation
The following values are hypothetical. They are not market prices or universal process targets.
| Theoretical aperture volume per panel |
250 mm³ |
|---|---|
| Transfer efficiency | 0.85 |
| Paste density | 4.0 g/cm³ |
| Usable PCB units per panel | 4 |
| Allocated process loss per panel | 0.20 g |
| Landed price | 0.072 currency units per gram |
| Expected good-board rate | 0.98 |
Deposited volume per panel = 250 × 0.85 = 212.5 mm³
Deposited mass per panel = 212.5 × 4.0 ÷ 1,000 = 0.85 g
Gross mass per panel = 0.85 + 0.20 = 1.05 g
Gross mass per printed PCB = 1.05 ÷ 4 = 0.2625 g
Cost per printed PCB = 0.2625 × 0.072 = 0.0189 currency units
Estimated cost per good PCB = 0.0189 ÷ 0.98 ≈ 0.0193 currency units
How to Handle Panels and Double-Sided PCBs
Panel-to-PCB Conversion
Paste cost per PCB = Paste cost per panel ÷ usable PCB units on the panel
Do not divide by the nominal array count when bad-marked units or intentionally unpopulated locations reduce usable output.
Double-Sided Printing
Calculate Side A and Side B separately because aperture volume, transfer efficiency, setup loss and even paste type may differ. Add both side costs before applying the expected final good-board rate.
Data Quality Problems That Distort the Result
| Data Problem | Likely Distortion | Correction |
|---|---|---|
| Reusable remainder is also included in closing inventory | Consumption is understated | Subtract the material only once |
| Gross package weight is recorded as paste weight | Consumption is overstated | Deduct verified container tare |
| Good-board definitions change between periods | Cost trends become invalid | Use one documented acceptance basis |
| Actual good boards are used and yield is divided again | Cost is overstated | Do not apply yield twice |
| Different materials or lots are pooled without traceability | Supplier comparison becomes unreliable | Separate records by material and lot |
| One-time qualification cost is mixed with routine consumption | Recurring unit cost is overstated | Amortize or report separately under finance policy |
Why Cost per Good PCB Matters More Than Price per Kilogram
A lower-priced paste can become more expensive when it creates unstable deposits, additional stencil cleaning, more rework, shorter usable stencil life or higher inventory write-off.
Solder paste inspection can provide the volume and variation data needed to evaluate transfer efficiency and print stability. Broader solder performance evaluation methods can support material qualification before a purchasing decision is based on price alone.
How to Normalize Two Supplier Quotations
| Quotation Field | What Must Match or Be Explained |
|---|---|
| Alloy | Exact composition and permitted tolerance |
| Powder Type | Type and controlled particle distribution |
| Flux system | Cleaning, residue and application requirements |
| Metal content | Test method and stated range |
| Package | Net usable weight and package type |
| Unit price | Price per usable gram or kilogram |
| Commercial terms | Currency, MOQ, freight, duties and quotation validity |
| Shelf life | Storage conditions and remaining life at delivery |
| Documentation | TDS, SDS, CoA, compliance and traceability records |
| Technical support | Trial, troubleshooting and response capability |
The solder paste brand comparison provides a broader framework for evaluating suppliers beyond unit price.
How to Reduce Solder Paste Cost Without Increasing Defects
- Buy according to realistic consumption rather than price breaks alone.
- Use FIFO and record opening, warming and stencil-use times.
- Control the amount loaded onto the stencil.
- Standardize setup and changeover quantities.
- Use the powder Type required by the smallest critical feature, not automatically the finest available.
- Review stencil geometry before changing to a more expensive paste.
- Improve first-pass yield through measured process control.
- Avoid uncontrolled recovery of expired, contaminated or untraceable paste.
Inventory write-off should be reviewed together with the documented solder paste shelf life. Specialized products such as lead-free low-temperature solder paste and semiconductor solder paste should be compared against their required process capability rather than against a generic commodity quote.
What to Include in a Solder Paste RFQ
- exact alloy or permitted alternatives;
- powder Type;
- flux and cleaning requirements;
- zero-halogen or other product requirements;
- printing, dispensing, jetting or rework method;
- smallest stencil aperture and stencil thickness;
- package type and net weight;
- monthly and annual consumption;
- required shelf life at delivery;
- destination and delivery terms;
- TDS, SDS, CoA and traceability requirements;
- trial quantity and technical-support expectations;
- quotation validity and price-adjustment method.
Relevant products can be reviewed in the YIHMA solder paste range. Application details can then be submitted through the inquiry form for a comparable quotation.
FAQ
Q: How do I calculate solder paste cost per PCB?
A: For an actual production period, multiply net paste consumed by landed price per gram and divide by actual good PCB units. For planning, estimate paste cost per printed PCB and divide by the expected good-board rate.
Q: How many PCBs can one kilogram of solder paste produce?
A: There is no universal number. It depends on aperture volume, transfer efficiency, density, process loss, panel size and yield.
Q: Should yield be included in the formula?
A: Use yield only in a planning model based on cost per board entering production. Do not divide by yield when the actual calculation already uses actual good boards as its denominator.
Q: How should panelized boards be calculated?
A: Calculate paste cost per panel, then divide by the usable PCB units on that panel. Adjust for bad-marked or scrapped units.
Q: Can used stencil paste be returned to the original jar?
A: Only when the product instructions and approved internal procedure explicitly permit it. Uncontrolled return can affect contamination, oxidation, consistency and traceability.
Q: Is the lowest price per kilogram the best value?
A: Not necessarily. Compare qualified materials using actual or estimated cost per good PCB, process stability, inventory risk and support requirements.
Conclusion
Use actual inventory and good-board records to calculate solder paste cost on an established line. Use aperture volume, transfer efficiency, density, process loss and expected yield only for preproduction planning.
The calculation is reliable only when its inventory boundary, units, panel conversion and cost scope are documented. A supplier quotation becomes meaningful when it is converted into a controlled cost per good PCB.